For three days the market barely moved, and the question everyone was asking was simple: when the flat line finally breaks, which way does it go? Today we got the answer — down. Bitcoin has slipped back to about $63,300, every major coin is in the red, and Solana took the hardest hit with a roughly 4% fall. There was no single dramatic headline behind it; this looks like the slow, steady pressure that has been building underneath finally winning out over the calm on top. Here is the plain-English version.
Where prices are today
The mixed, near-flat tape of the past few days is gone. Today the whole board is red:
- Bitcoin (BTC): about $63,300, down roughly 1.3% on the day
- Ethereum (ETH): about $1,711, down roughly 1.3%
- XRP: about $1.11, down roughly 1.7%
- Solana (SOL): about $70.86, down roughly 4.0%
The total value of all crypto sits at about $2.26 trillion, down roughly 0.9% on the day, with Bitcoin making up about 56% of it. After three days clustered near flat, this is the first clean directional move in a while — and it is lower. The losses are not huge by crypto standards, but they are broad: there is no green coin hiding in the corner, and the riskier names fell hardest. Solana dropping about three times as much as Bitcoin is the tell. When the whole market leans the same way and the more speculative coins lead the slide, it usually means risk appetite is cooling rather than any one project being in trouble.
Why the market turned lower
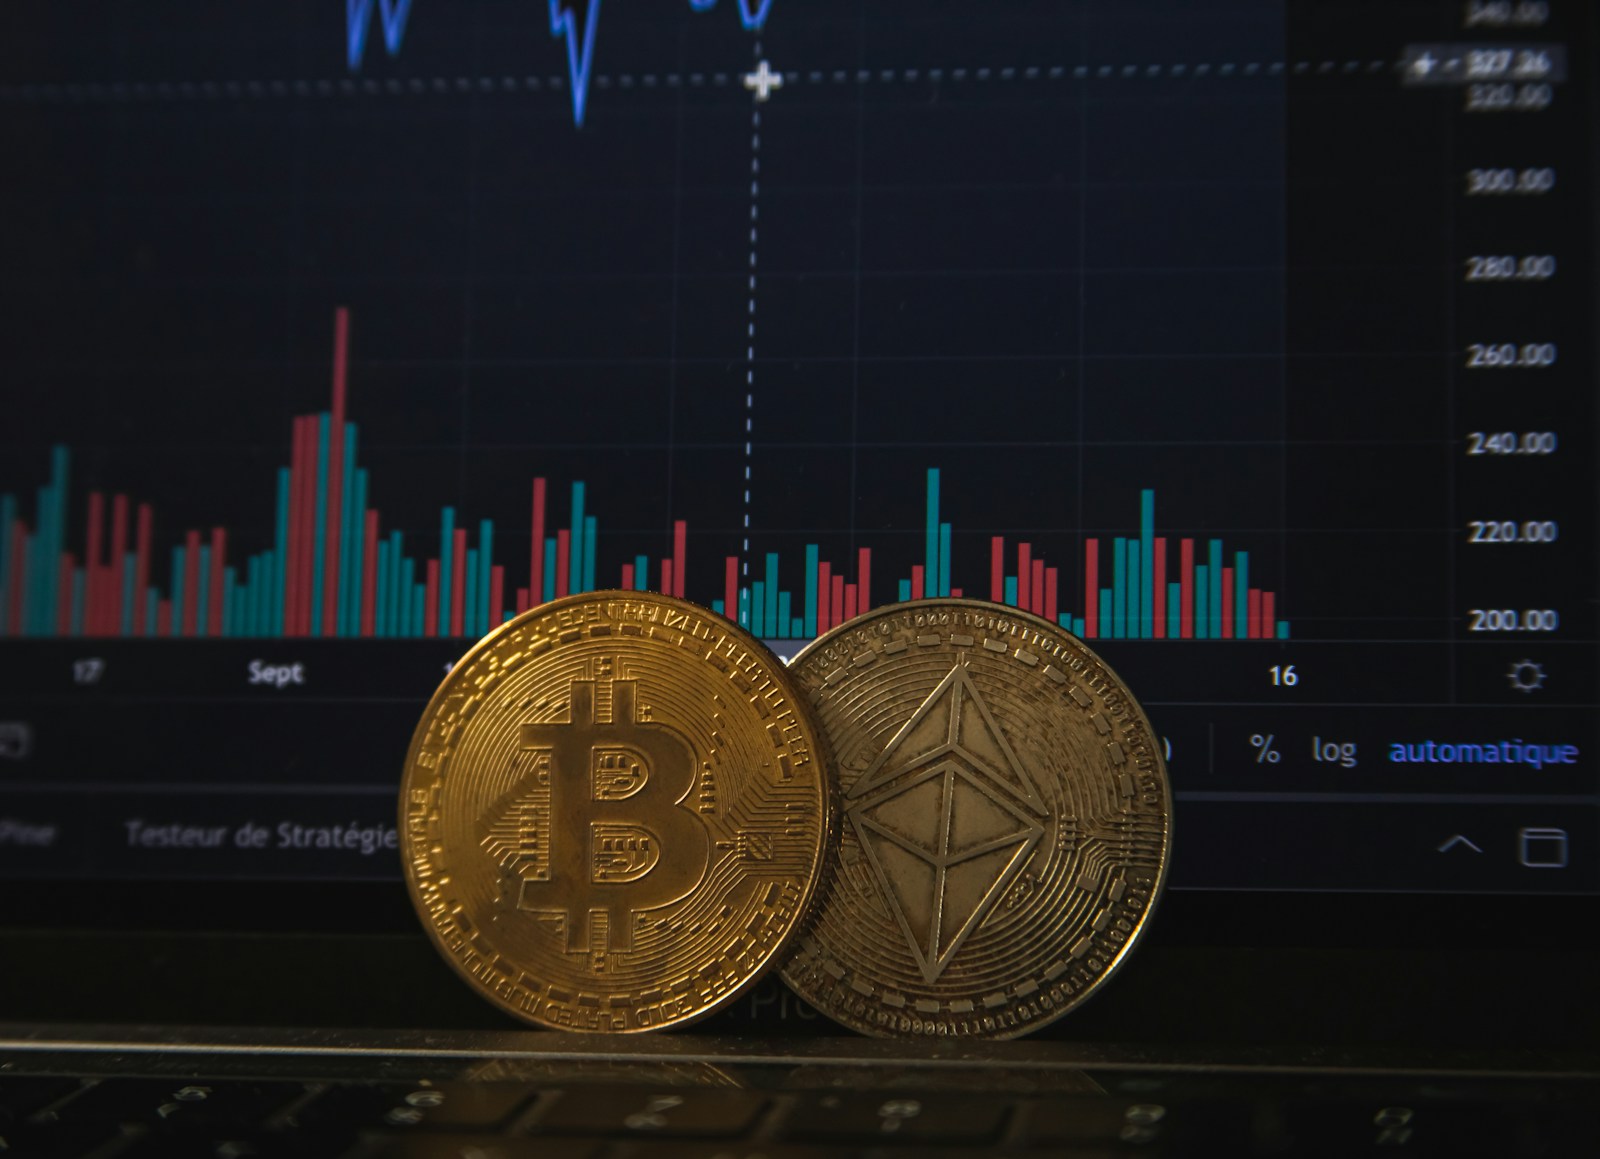
There was no fresh shock overnight — no surprise policy move, no blow-up. What broke the calm was the same slow pressure that has been there all week, simply outlasting the quiet.
- The money keeps leaving. The big US Bitcoin ETFs — the funds that let regular investors hold Bitcoin through an ordinary brokerage account — have now bled money for three straight weeks, with more than $4 billion pulled out over that stretch. The Ethereum funds are draining too. This is not panic selling; it is a steady, grinding outflow of exactly the kind of large, regulated money that propped prices up on the way in. A flat price can sit on top of that tide for a while, but eventually the tide wins. Today looks like the day it did.
- "Higher for longer" still hangs overhead. The backdrop has not budged. Government bond yields are sticky up near 4.45%, the new Fed chair is expected to keep leaning hawkish, and the rate-cut hopes that crypto was counting on have faded. When safe cash and bonds pay a solid return, a coin that pays no interest has to fight harder to justify itself — and big institutional money, which watches that trade-off closely, keeps choosing the yield. That is the engine behind the steady ETF outflows.
Neither of these is new, and that is the point. The market spent three days pretending the pressure wasn't there. Today it stopped pretending.
The fear gauge: a small twist
The Crypto Fear and Greed Index — a simple 0-to-100 mood meter where low means fear and high means greed — sits at 23 today, actually up from 20 yesterday, even though prices fell.
That sounds backwards, so it is worth a plain explanation. The gauge is not just a price tracker; it blends in things like trading volume, volatility, and momentum. A modest, orderly drop after days of dead-flat trading can actually register as slightly less fearful than a tense, motionless standoff — because the move, while down, was calm rather than chaotic. So the gauge nudged up a few points back toward where it sat earlier in the week.
Do not over-read it in either direction. At 23 the market is still firmly in "extreme fear," and a three-point uptick on a red day tells you almost nothing about tomorrow. What it honestly says is narrow: today's decline was steady, not a panic, and sentiment has not collapsed alongside the price. That is the whole message.
What to watch next
- Whether this is one red day or the start of a slide. A single down day after a quiet stretch is not a trend. Watch whether Bitcoin steadies in the low-$63,000s or whether the selling builds and drags it back toward last week's lows. The first red candle is a question, not an answer.
- The ETF flows, still. This remains the clearest read on big-money sentiment. Three weeks of outflows is what tipped today lower; if those flows slow or reverse, it would be the strongest sign that institutions are stepping back in. If they keep draining, more red days are the likeliest path.
- Any softening in the rate story. The whole episode traces back to interest rates, so it ends there too. Watch upcoming economic data and Fed commentary for any hint the "higher for longer" stance is easing — that is the single thing most likely to turn the mood and the money back around.
The takeaway
The three-day standoff finally broke, and it broke to the downside: Bitcoin back near $63,300, every major coin red, Solana down about 4%. There was no dramatic trigger — just the steady ETF outflows and the unshaken "higher for longer" rate backdrop finally outweighing the calm. The one quirk, the fear gauge ticking up to 23 even as prices fell, is a reminder that a slow, orderly drop is not the same as a panic.
If you are investing, a broad red day is exactly when the urge to do something gets loudest — and usually when doing nothing is the smarter call. One down day after three flat ones is not a signal to bail, just as it is not a green light to pile in. The boring advice does not change with the color of the tape: think in years, not days. Consider buying small fixed amounts on a regular schedule rather than trying to time the bottom, and size your position so that whichever way this resolves, it is uncomfortable rather than life-changing.
Crypto is volatile. You may lose all the money you invest. Only put in what you can afford to be wrong about.